Better Ski Maps - Tinkurlab: SlopeStyle
Tinkurlab is going spatial!
We’re adding maps and spatial data to our visualization techniques.
Keep reading for the first foray into mapping…ski slopes!
——–
You’ve heard it all before.
“This run would totally be a green out west.” “This resort isn’t as hard as my home mountain.” “A blue here doesn’t equal a blue there.”
Really? Are you sure? The resorts themselves state that trail ratings are subjective to that particular mountain. Green – Blue – Black – Double Black…and what are those RED trails about in Europe? Even snow conditions can change the rating of one particular trail.
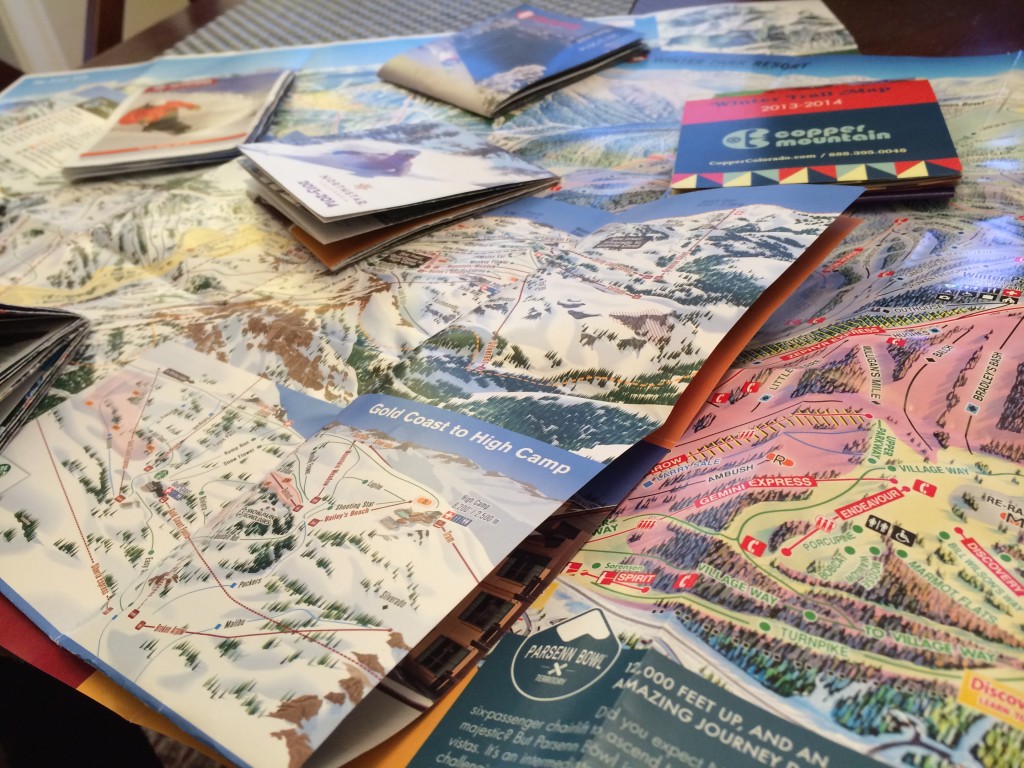
Ski trail maps are works of art; designed by a couple people to make you want to visit the resort and display the number of trails- but how much can a color tell you? If it’s the right color, turns out a whole lot. Enter Tinkurlab:SlopeStyle.
Earlier this winter, Adam and I relocated from Washington DC to Denver, and had many more ski resorts available to us within a 2 hour drive. Resources like FreshyMap helped us determine which one to hit up with a quick glance. With so many choices, I was curious about finding a way to objectively compare resorts and tell which parts of the resorts I wanted to ski. In ski progression, it’s easy to both stay on terrain that you are better than or find yourself in way over your head. I wanted a way to know what I was getting into before I took that first turn.
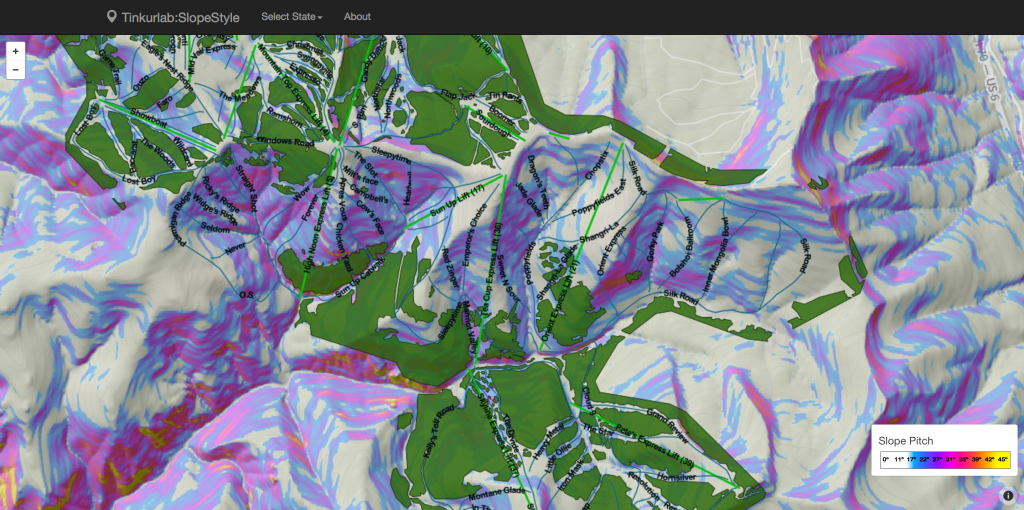
Tinkurlab:Slopestyle lets you visually explore the pitch and slope angle of your favorite ski runs. With this data, you can easily compare these runs with others at the same resort to find new terrain. Additionally, since the color-coding is the same across the maps, you can now compare resorts with each other. Pink is pink, no matter where you are! The site performs the same on a desktop as on a phone, allowing you to plan your runs from any type of chair you’re sitting on. Happy skiing! If interested, please read further for the technical details on how the site was created.
Built by processing USGS elevation data with GIS commands to calculate and thematically render slope pitch in degrees.
What I needed to start was elevation data. I found what I was looking for thanks to the USGS. They publish layers in varying degrees of resolution and are available for download using The National Map. I selected the files for the sections of Colorado and California that I required, and set about processing the data.
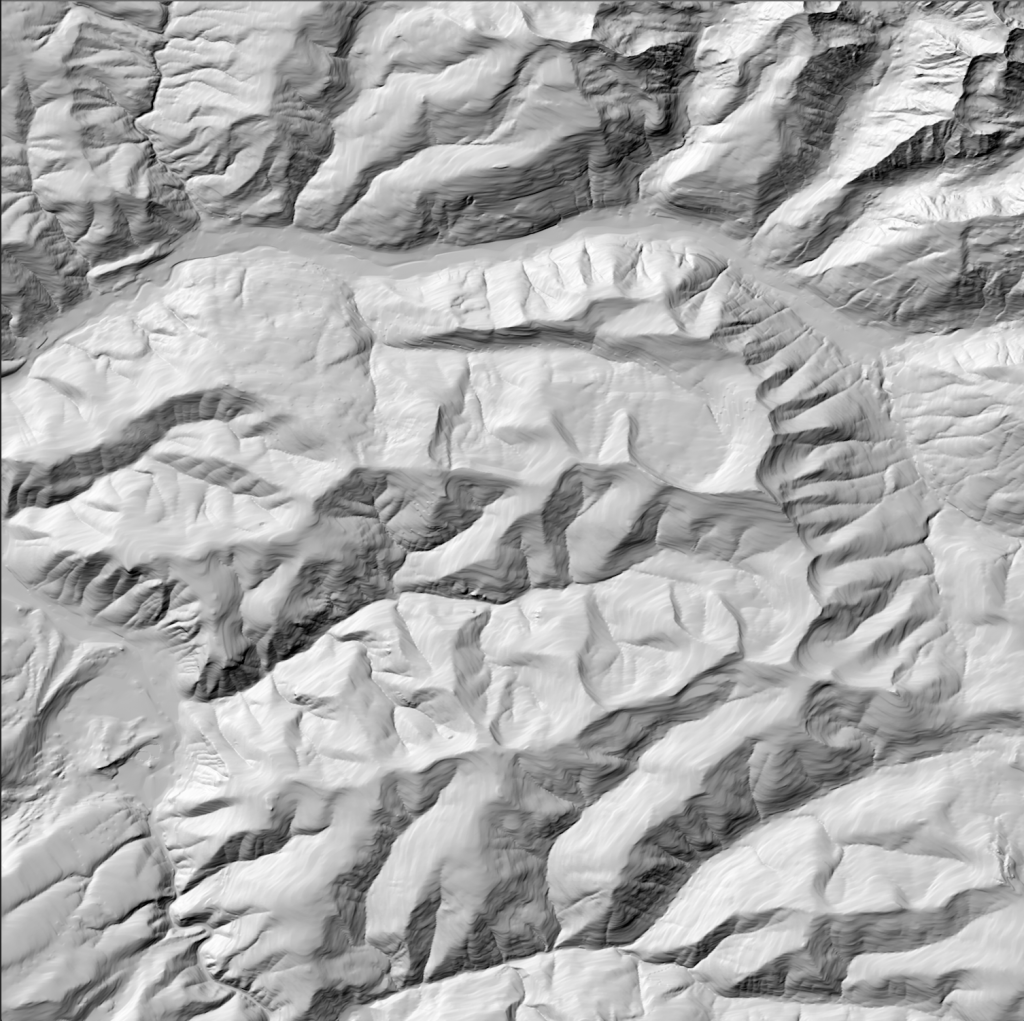
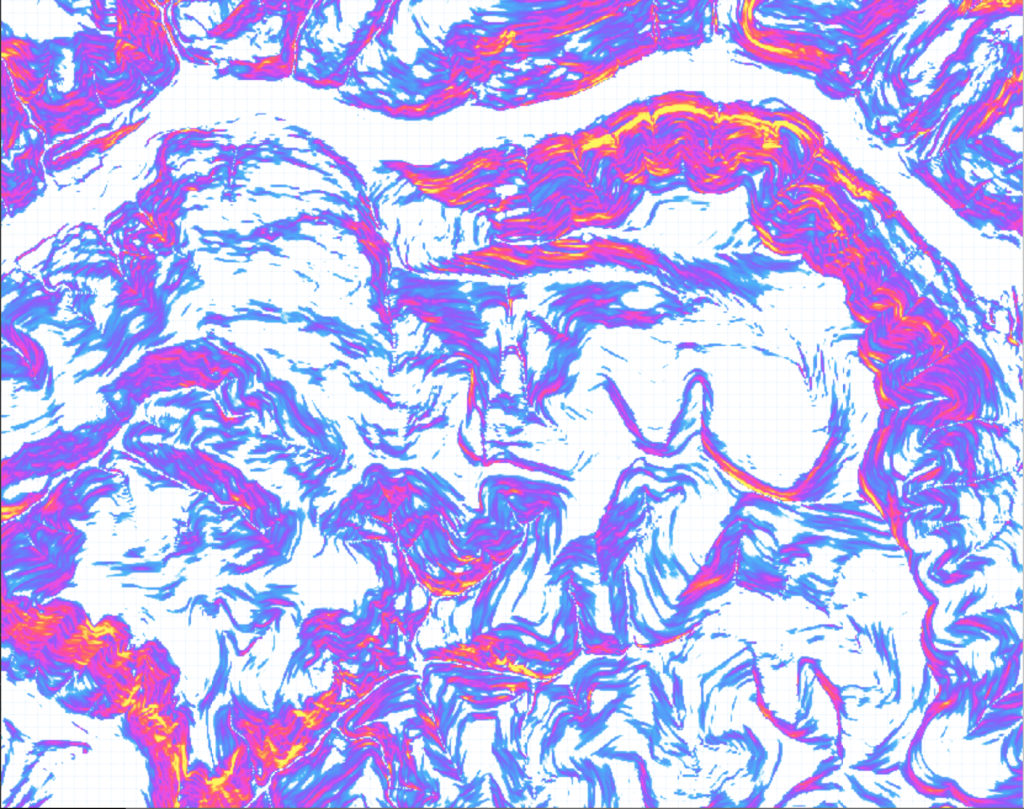
I used the GDAL utility as my primary GIS tool. It’s open source, and allows the user to execute a variety of commands for translating and processing raster data. Using the command-line operators, I was able to create greyscale hillshade layers and calculate the slope for the terrain I was interested in. I then selected break points for the slope degrees, and generated a color-reilef map based on the pitch.
Example commands:
gdaldem hillshade -s 111120 DEM.adf hillshade.tif
gdaldem slope -s 111120 DEM.adf slopedegree.tif
gdaldem color-relief slopedegree.tif slope-ramp.txt slopeshade.tif -alpha -co ALPHA=YES
Ski resort data overlaid using OpenStreetMap exports stored in PostGIS databases.
The next step was to get the trail map data. My initial plan was to find a web service containing the features and add it to my map. That search did not yield great results, so I switched to plan B and learned how to use OpenStreetMap exports.
I used JOSM to extract the aerialway, downhill and woods features for the ski resorts included in my beta site. Once I had the .osm data, I used osm2pgsql commands to add the features to a PostGIS extended PostgreSQL database. I found the LearnOSM tutorial extremely helpful (I’m using a Mac with OSX Mavericks, and was able to follow along with the Windows prompts.)
Visualized using Mapbox TileMill and Mapbox Javascript API.
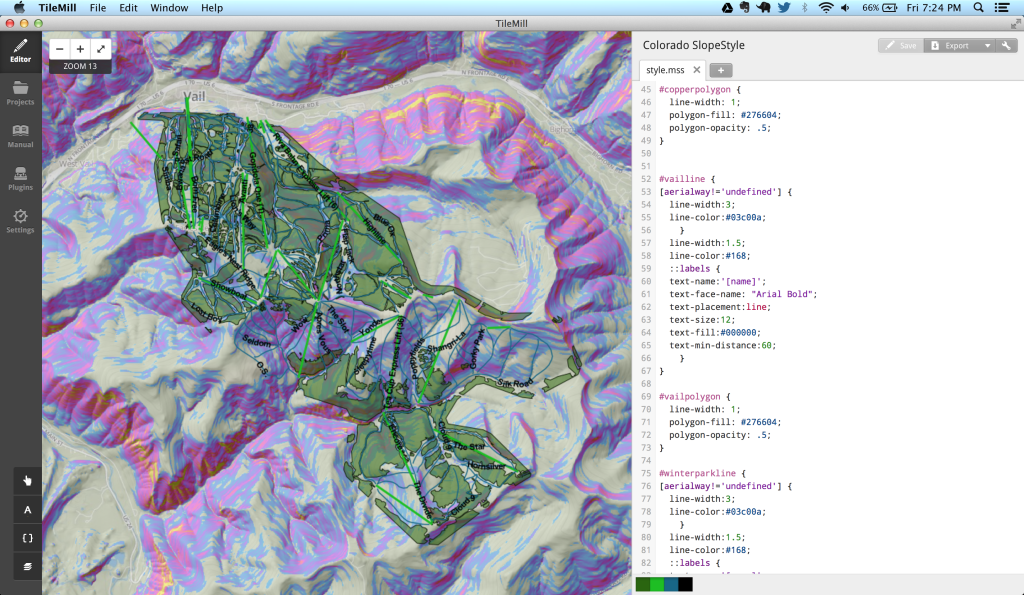
Once I had the data downloaded and processed, it was time to put it all together and create some maps. I chose to use Mapbox TileMill to combine my layers and create map tiles. The Carto CSS-like language enabled styling control, and the built in raster and PostGIS support made adding data incredibly easy.
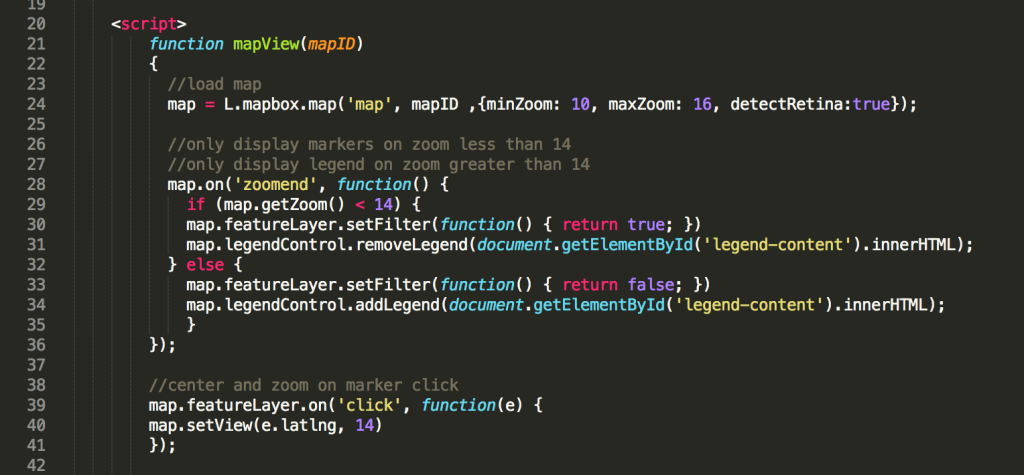
The tile packages were uploaded to the Tinkurlab Mapbox account, and I set about creating the interactive web map using their javascript API. The examples are straightforward, and with a couple lines of code, I was up and running.
Packaged in a responsive website.
It was important to house the webmap in code that would render correctly on any device. You might investigate the resorts on a desktop at home, but on the mountain, you’re going to be on a phone. The Twitter Bootstrap framework is perfectly suited for this application. Both Tinkurlab:Maps and SlopeStyle are built using Bootstrap with some custom CSS files.
The application defaults to the I70 corridor resorts in Colorado, but the user has the option to switch to the Lake Tahoe area and back. I chose to focus on the resorts that we skied the season, but plan on expanding in the future. Other features in the future might include the ability to select a run to view it’s entire slope profile, as well as rendering the slope colors based on your personal ski preferences. Keep checking back for updates!
– Val
Comments ()